Use Case: Data Ingestion Monitoring with AME
Data ingestion failures often go unnoticed until it's too late. In this post, we share how a simple detection layer + Alert Manager Enterprise monitors ingestion health.
Introduction
As a former consultant at heart working with Splunk environments, I have seen that data ingestion monitoring is becoming more and more important.
Customers build detections, dashboards, and reports, assuming that data will keep arriving once the forwarders and inputs are in place. Once everything is in place, nobody thinks about the fact that ingestion can quietly degrade (silent dropouts, latency increases, volume changes unexpectedly, or data completely blacking out).
Sometimes it can take hours, days, or longer before anyone notices. By then the impact is already downstream: stale dashboards, missed detections, audit findings, or worse.
The root causes fall into the following areas:
- Once the setup is complete, many teams assume the pipeline is self-monitoring
- Splunk's Monitoring Console offers broad visibility, but rarely the granular, threshold-based per-source checks that catch real problems early
- Adding more alerts feels risky in heavily loaded environments
- Responsibility for end-to-end ingestion health is diffuse across ops, security, and analytics teams
The result is eroded trust in the entire stack due to data gaps.
Monitoring Data Ingestion
A couple of weeks ago one of the more popular ingestion monitoring apps in the Splunk ecosystem announced it would move away from its free license model entirely. That change leaves many customers in the lurch, as there's no immediate budget around.
That announcement made me think: what does a minimal ingestion monitoring setup actually require, and how much of the incident management and response side can be handled very effectively by Alert Manager Enterprise (AME), even with the free version of our app?
I quickly put together a small proof-of-concept Splunk app called Data Ingestion Monitor (DIM), just to see what the core detection layer would look like.
My requirements for DIM were:
- Define the sources you care about (index + sourcetype, optional host filter)
- Set basic per-source thresholds: min/max event count per window, min/max volume in MB, max indexing lag, max end-to-end latency
- A handful of scheduled searches (bundled efficiently) compute the metrics and write current status to the KV Store
- A straightforward dashboard shows health summary cards, recent issues, and a source table with sparklines
- Markers for failed checks (Missing Data, Volume issues, Lag too high, Latency too high, etc.)
- Visualize historic data
Nothing fancy. No ML, no external services, just native Splunk pieces.
The app answers the four most important questions:
- Is the source still sending data?
- Are volumes roughly in the expected range?
- Is indexing lag acceptable?
- Is the latest data reasonably fresh?
With this, I was able to wire it up with Alert Manager Enterprise (AME). AME takes the detection of the DIM app from the lookup table and turns the results into actionable AME events.
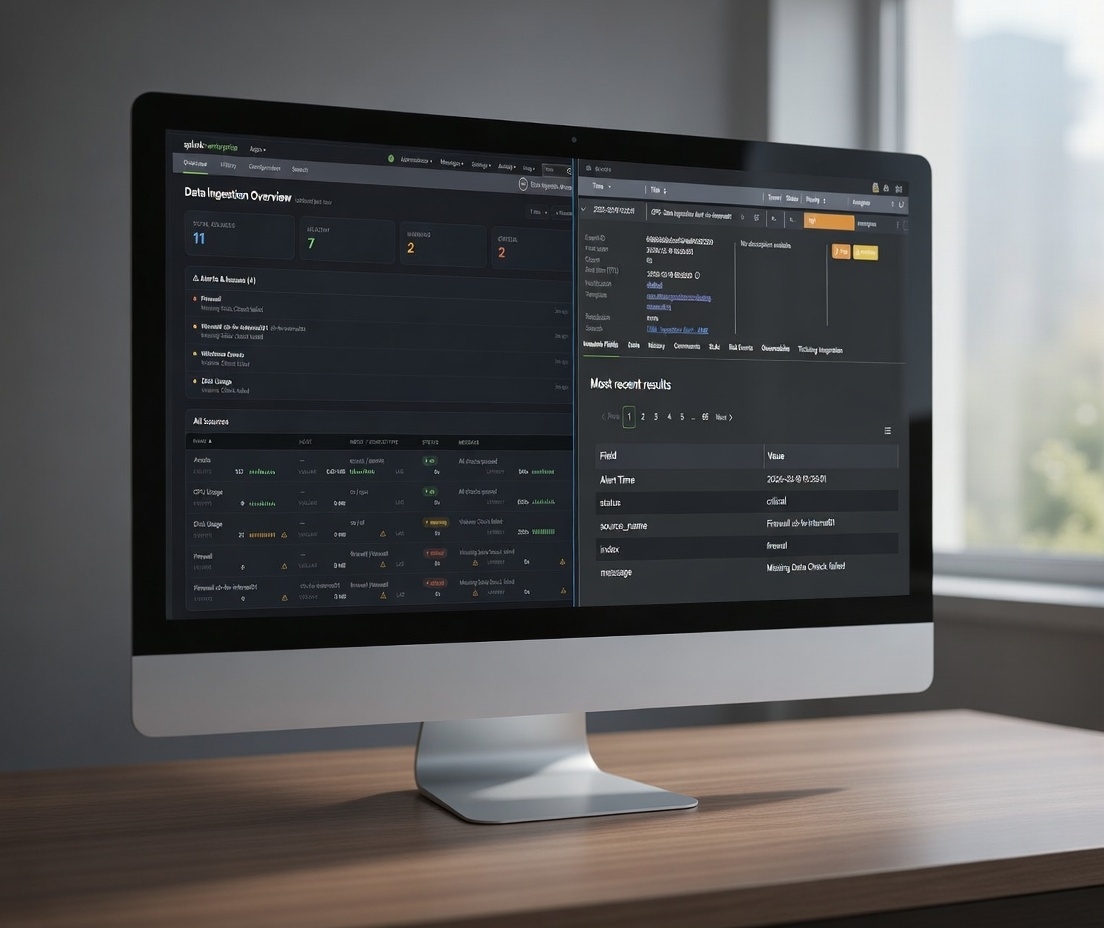
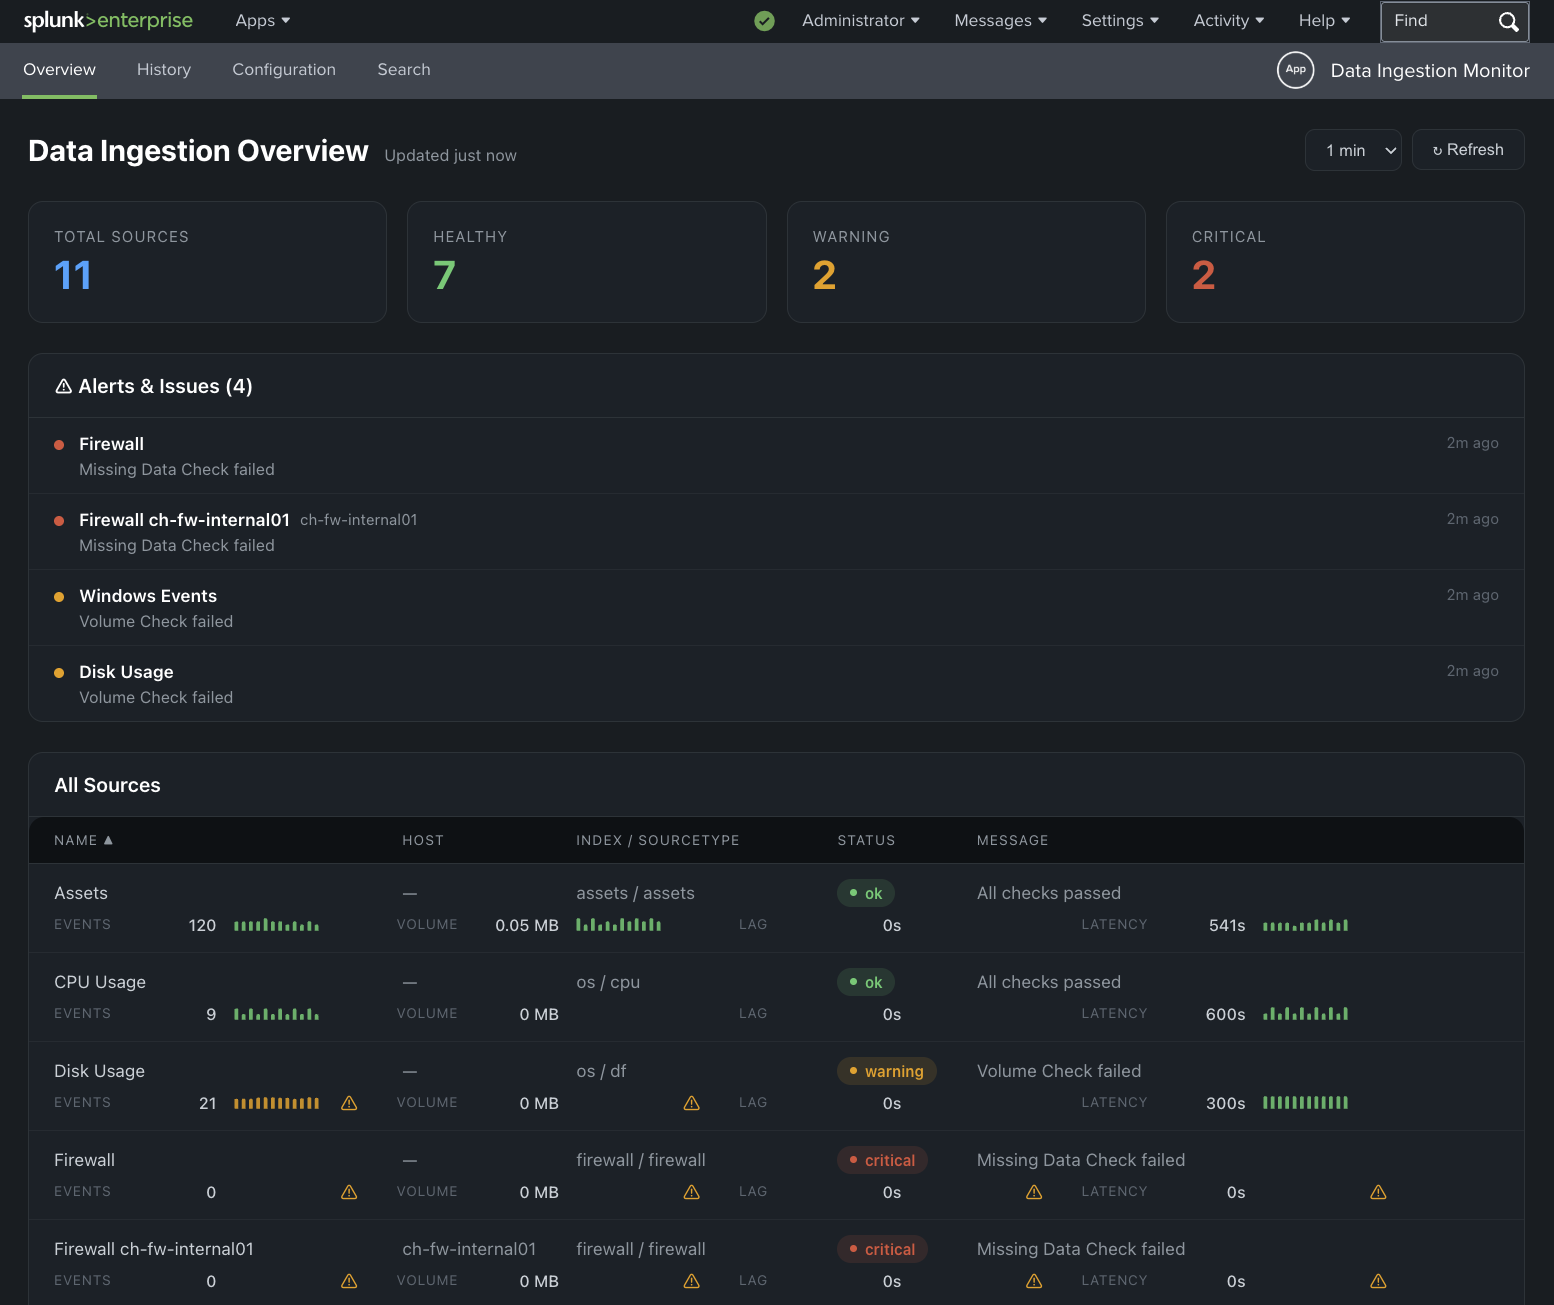 Data Ingestion Monitor - Proof-of-Concept
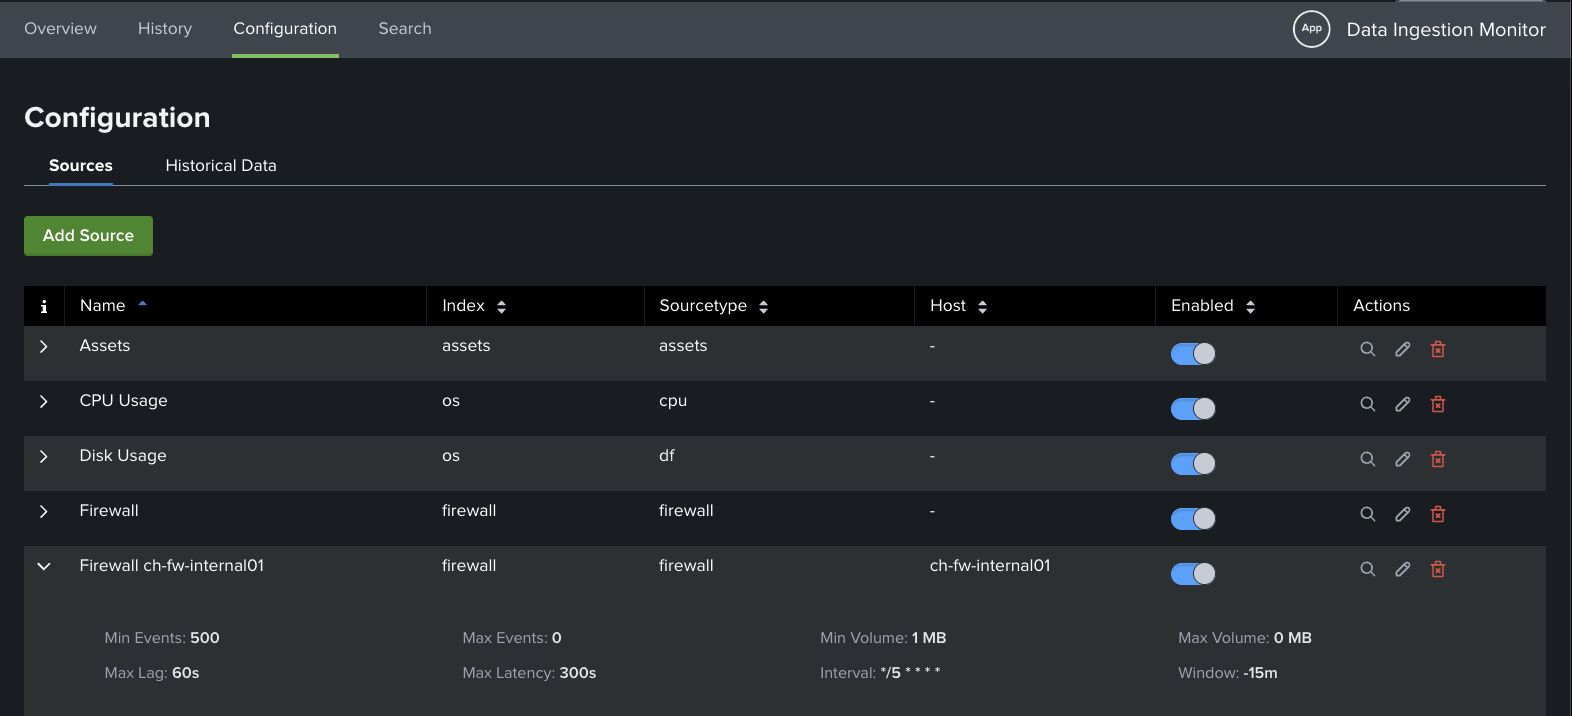 Data Ingestion Monitor - Configuration Page
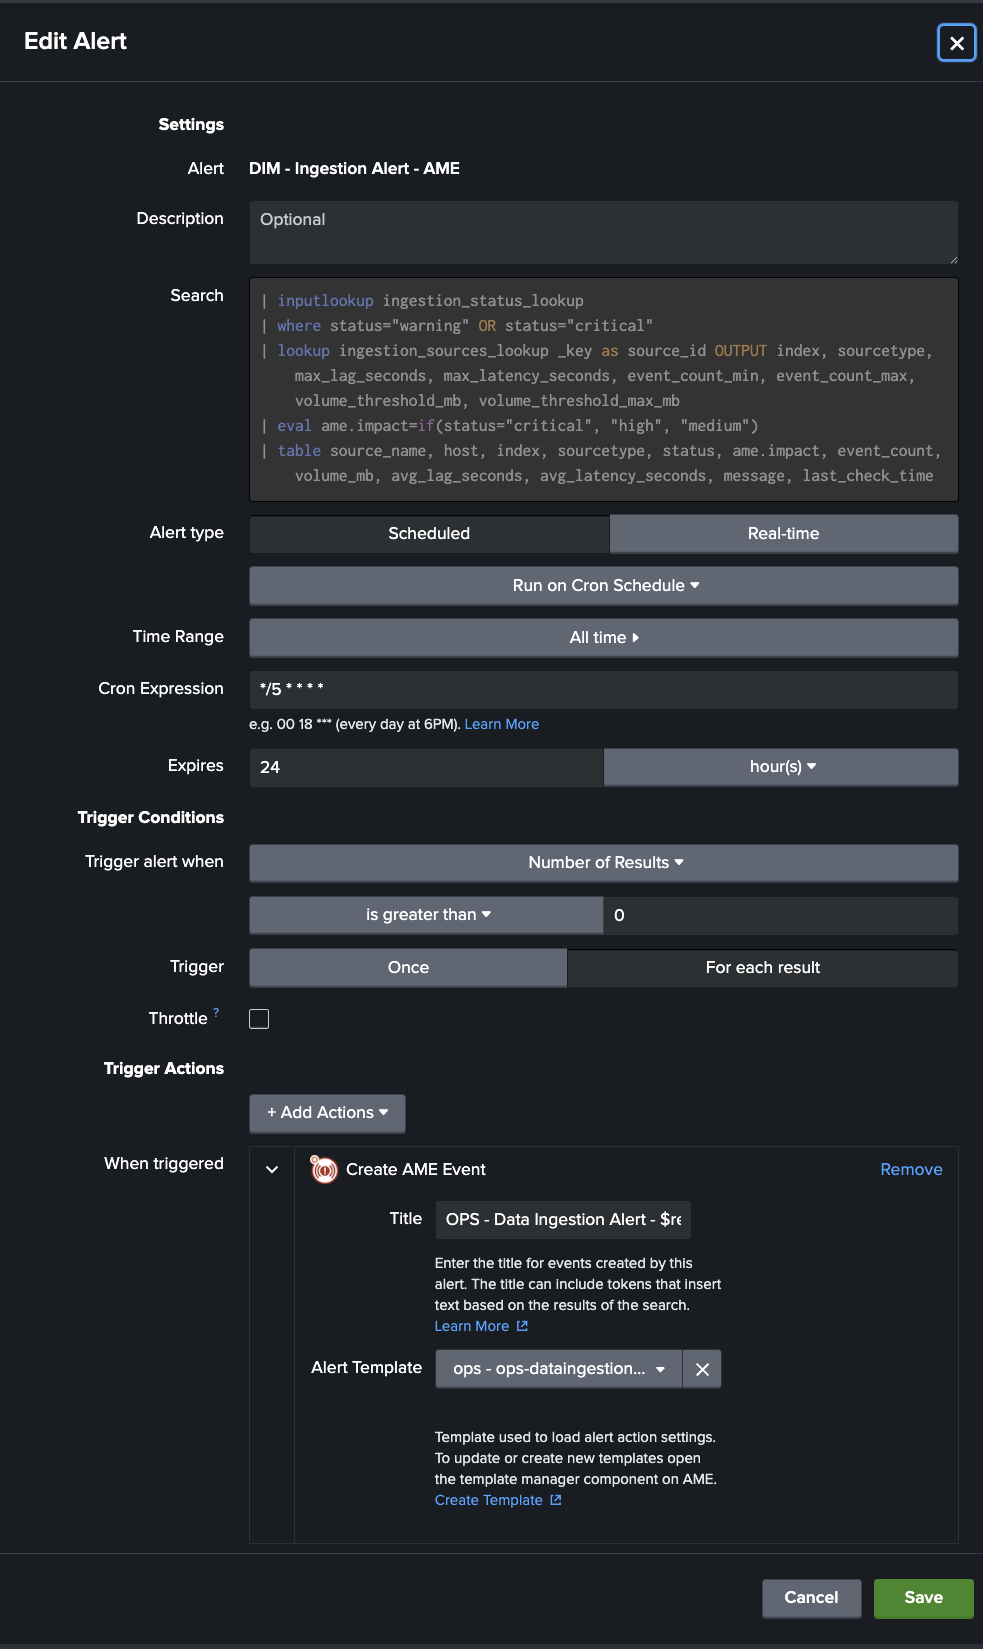 DIM - AME Integration
Templates & Rules
Ingestion alerts can be noisy in predictable ways. On weekends there are quiet periods, repeating or planned maintenance windows, daily batch jobs during nights, or known low-activity sources during off-peak hours. With the help of AME's templates and Rules (cron-based or condition-based) noise can be reduced efficiently.
The following situations can be handled:
- Suppress or auto-close warnings that resolve themselves quickly (e.g. latency spike under 5 minutes)
- Auto-assign based on source or index ("Windows Events" to ops, "Vulnerability Scan Results" to security, "Webserver" to application team)
- Cron-based rules for maintenance windows: suppress all ingestion alerts from a specific set of sources (or entire indexes) between 02:00 and 04:00 every Saturday
- Conditional rules: only suppress if the alert matches a particular host that you know is involved in scheduled maintenance activity
After tuning templates and rules, most customers see a substantial drop in actionable events. Maintenance-related false positives can be avoided.
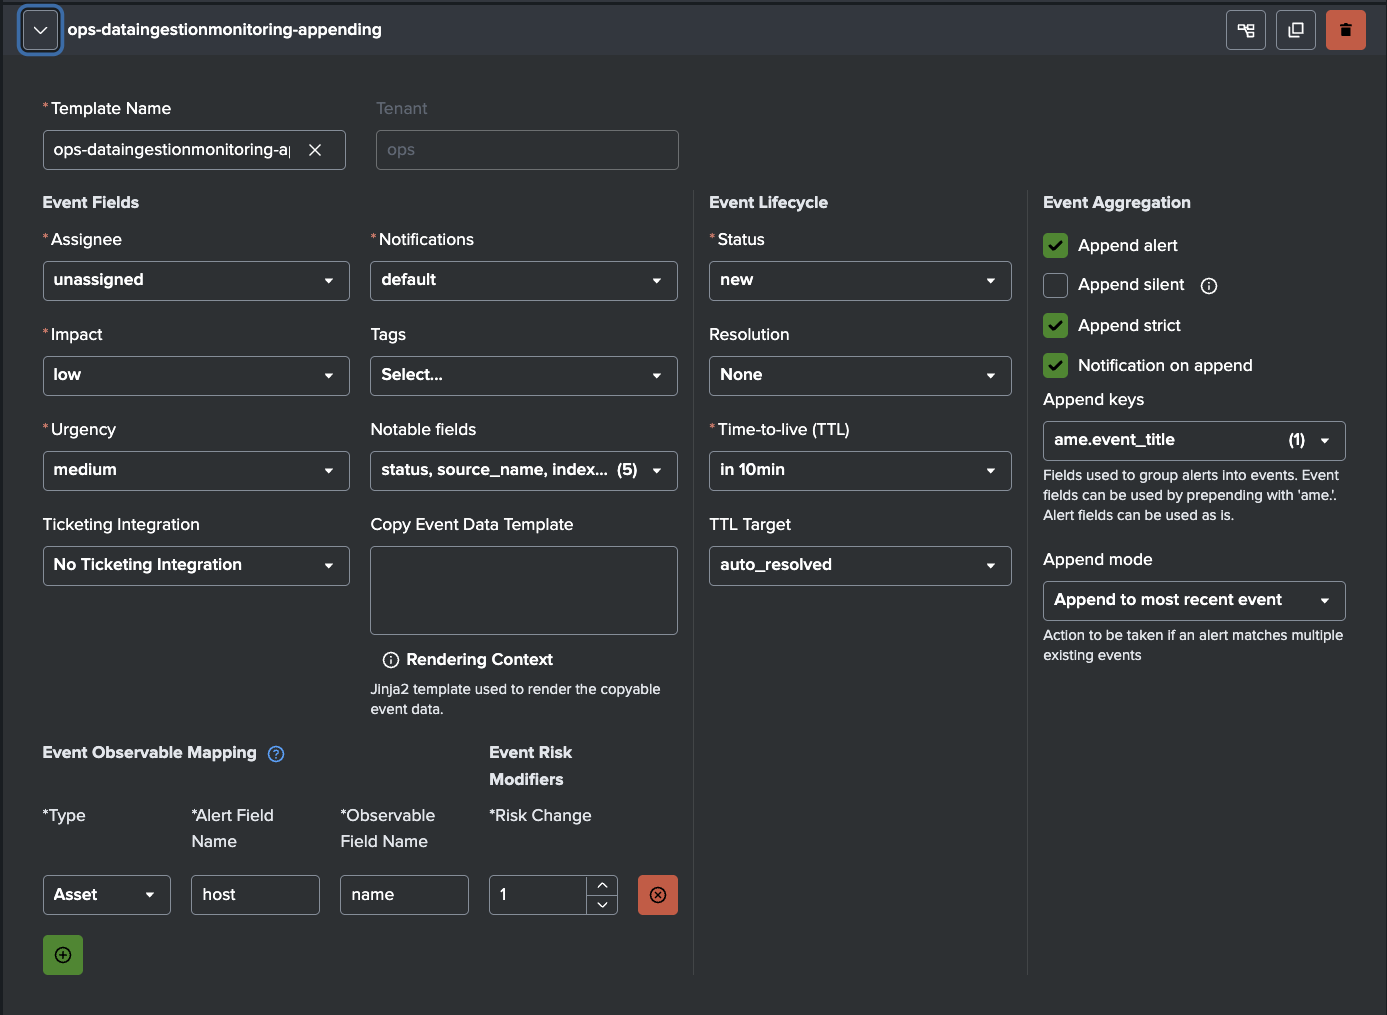 AME Template for DIM Detections
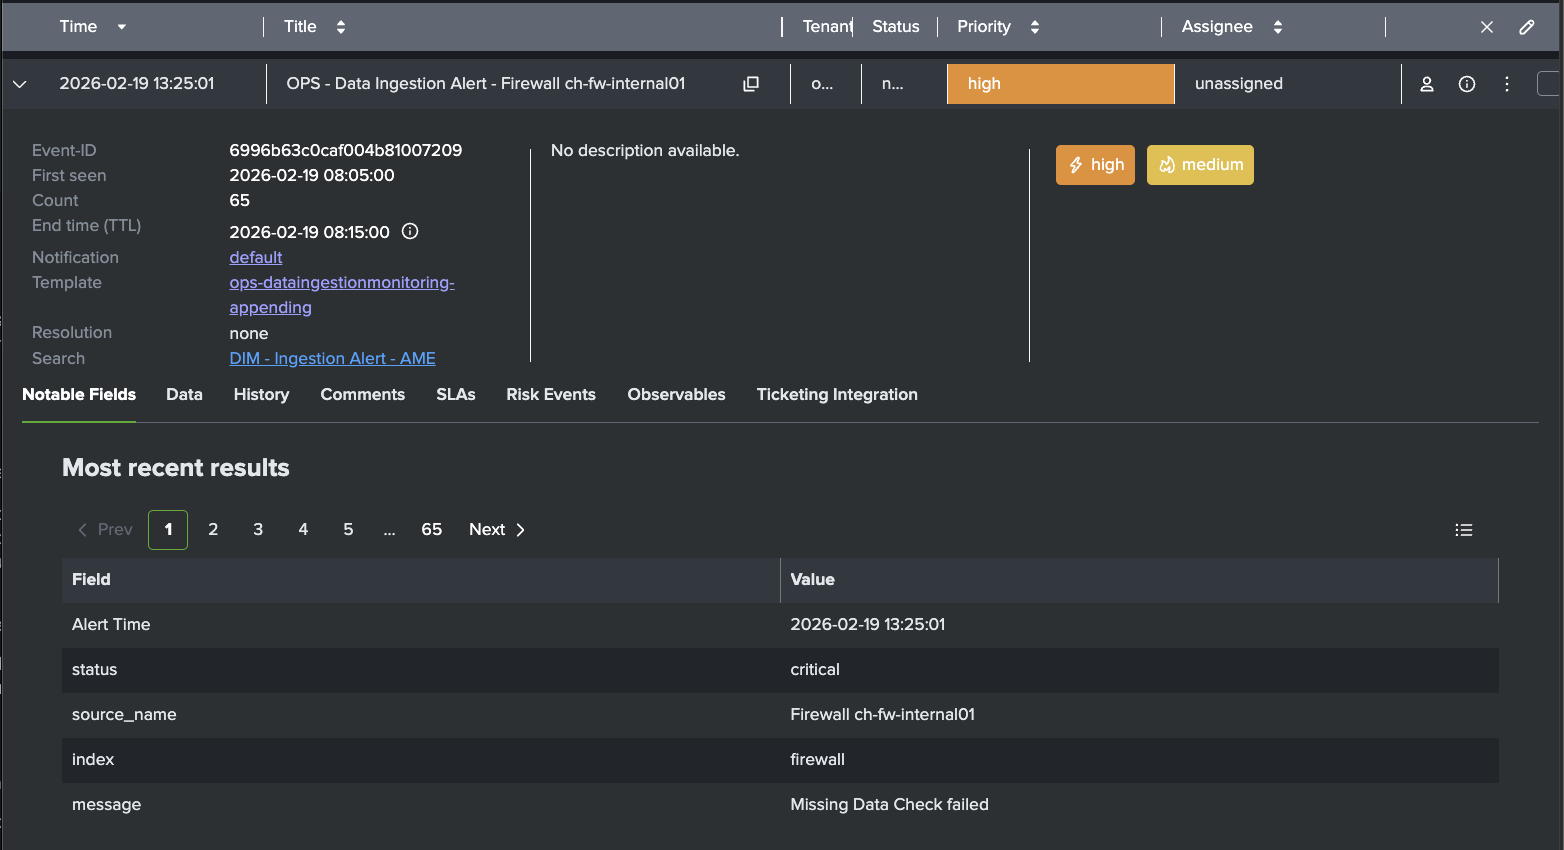 AME Example Event for Missing Firewall Logs
SLAs
Many ingestion issues are not solved in time because no hard limits exist. AME's Service Level Agreements attach enforceable deadlines to every event.
Examples:
- Critical alerts (missing data from security, firewall, identity, or compliance-critical sources): acknowledge in 15 minutes, resolve in 60 minutes
- Warning-level issues (low volume on operational sources like disk, cpu, windows events): acknowledge in 30 minutes, resolve in 4 hours
- High-business-impact sources: tighter SLAs (e.g. 10-minute ack)
AME tracks compliance automatically, escalates on breach, and gives auditable reporting. It turns ingestion health from "someone will look eventually" into a measurable commitment.
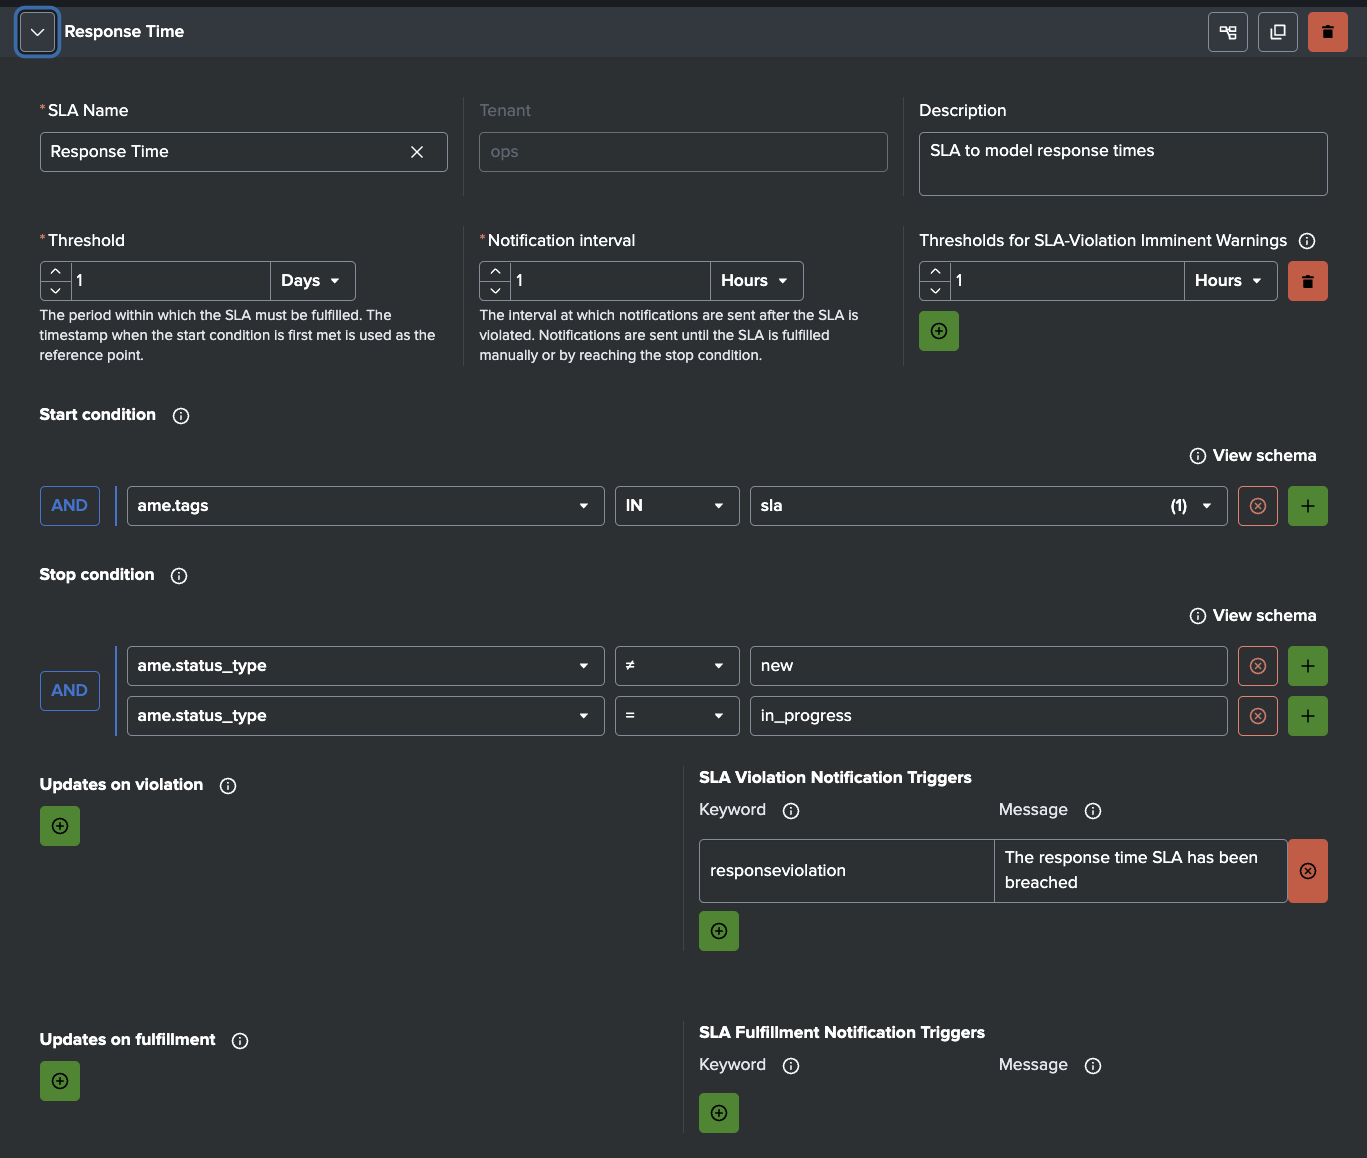 AME - Sample Response Time SLA
Notifications & Integrations
AME supports Slack, Teams, email, webhooks, Jira, ServiceNow, and more. As DIM sends alerts that contain fields such as source_name, status, event_count, volume_mb, avg_lag_seconds, etc., notifications arrive with context.
Typical Notifications:
- Critical failure: instant Slack message to the on-call engineer
- Warning: email to the team lead
- SLA breach: automatic notification to the responsible manager
When the problematic feed is not under your team's control (third-party vendors, other internal teams, cloud providers), AME's Jira and ServiceNow integrations are especially powerful. You can configure rules to automatically create a ticket in the upstream team's system, assign it to the right queue, pre-fill it with source name, index, failure details, metrics, and a link back to DIM or the AME event, and set the priority or the SLA based on criticality.
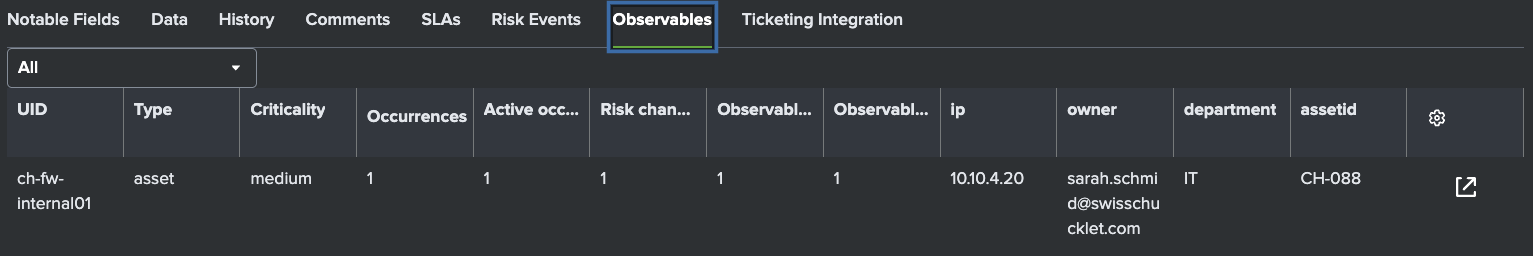
Observables
AME's Observables let you attach structured asset/identity context to ingestion sources (e.g. owner_team, criticality, business_unit, asset ID).
When an alert arrives, AME matches fields (host, source_name, index) against observables and enriches the event automatically and can also increase the risk score for this asset.
Summary
In short: a minimal detection layer gives you early visibility into ingestion health. Alert Manager Enterprise takes it from there, keeping signal from noise. AME handles exceptions smartly (templates & rules), enforces urgency (SLAs), applies real ownership (notifications & integrations), and enriches events with context (observables). Ingestion problems get caught early, routed to the right people (or upstream teams), and most important, actually get resolved instead of quietly forgotten.
If ingestion monitoring has been more of an afterthought in your Splunk environment, or if a tool you relied on just changed its licensing and left you scrambling, you don't need to spin up a six-month custom monster. A lightweight detection setup (even just a few well-crafted scheduled searches) paired with AME can close the visibility gap in days and turn vague unease into measurable reliability.
Learn More
Read our docs to learn how to install and configure AME.
Download AME from Splunkbase.
Don't forget to check out our YouTube channel for tutorial videos.